

How it works
Brainer counts visits to your website by itself from the moment it’s live. There’s nothing to install or connect. It also brings in the numbers from everything your team does: ads, emails, posts and blog articles. So you can see, in one place, which work is actually bringing people to your site. Your CEO reads these same numbers at every check-in and uses them to decide what the team does next. You can look any time, or just ask the CEO what the numbers say.Where do I find it?
Click “Analytics” in the sidebar. There are three tabs: “Website”, “Product” and “Business”. The date range is at the top right.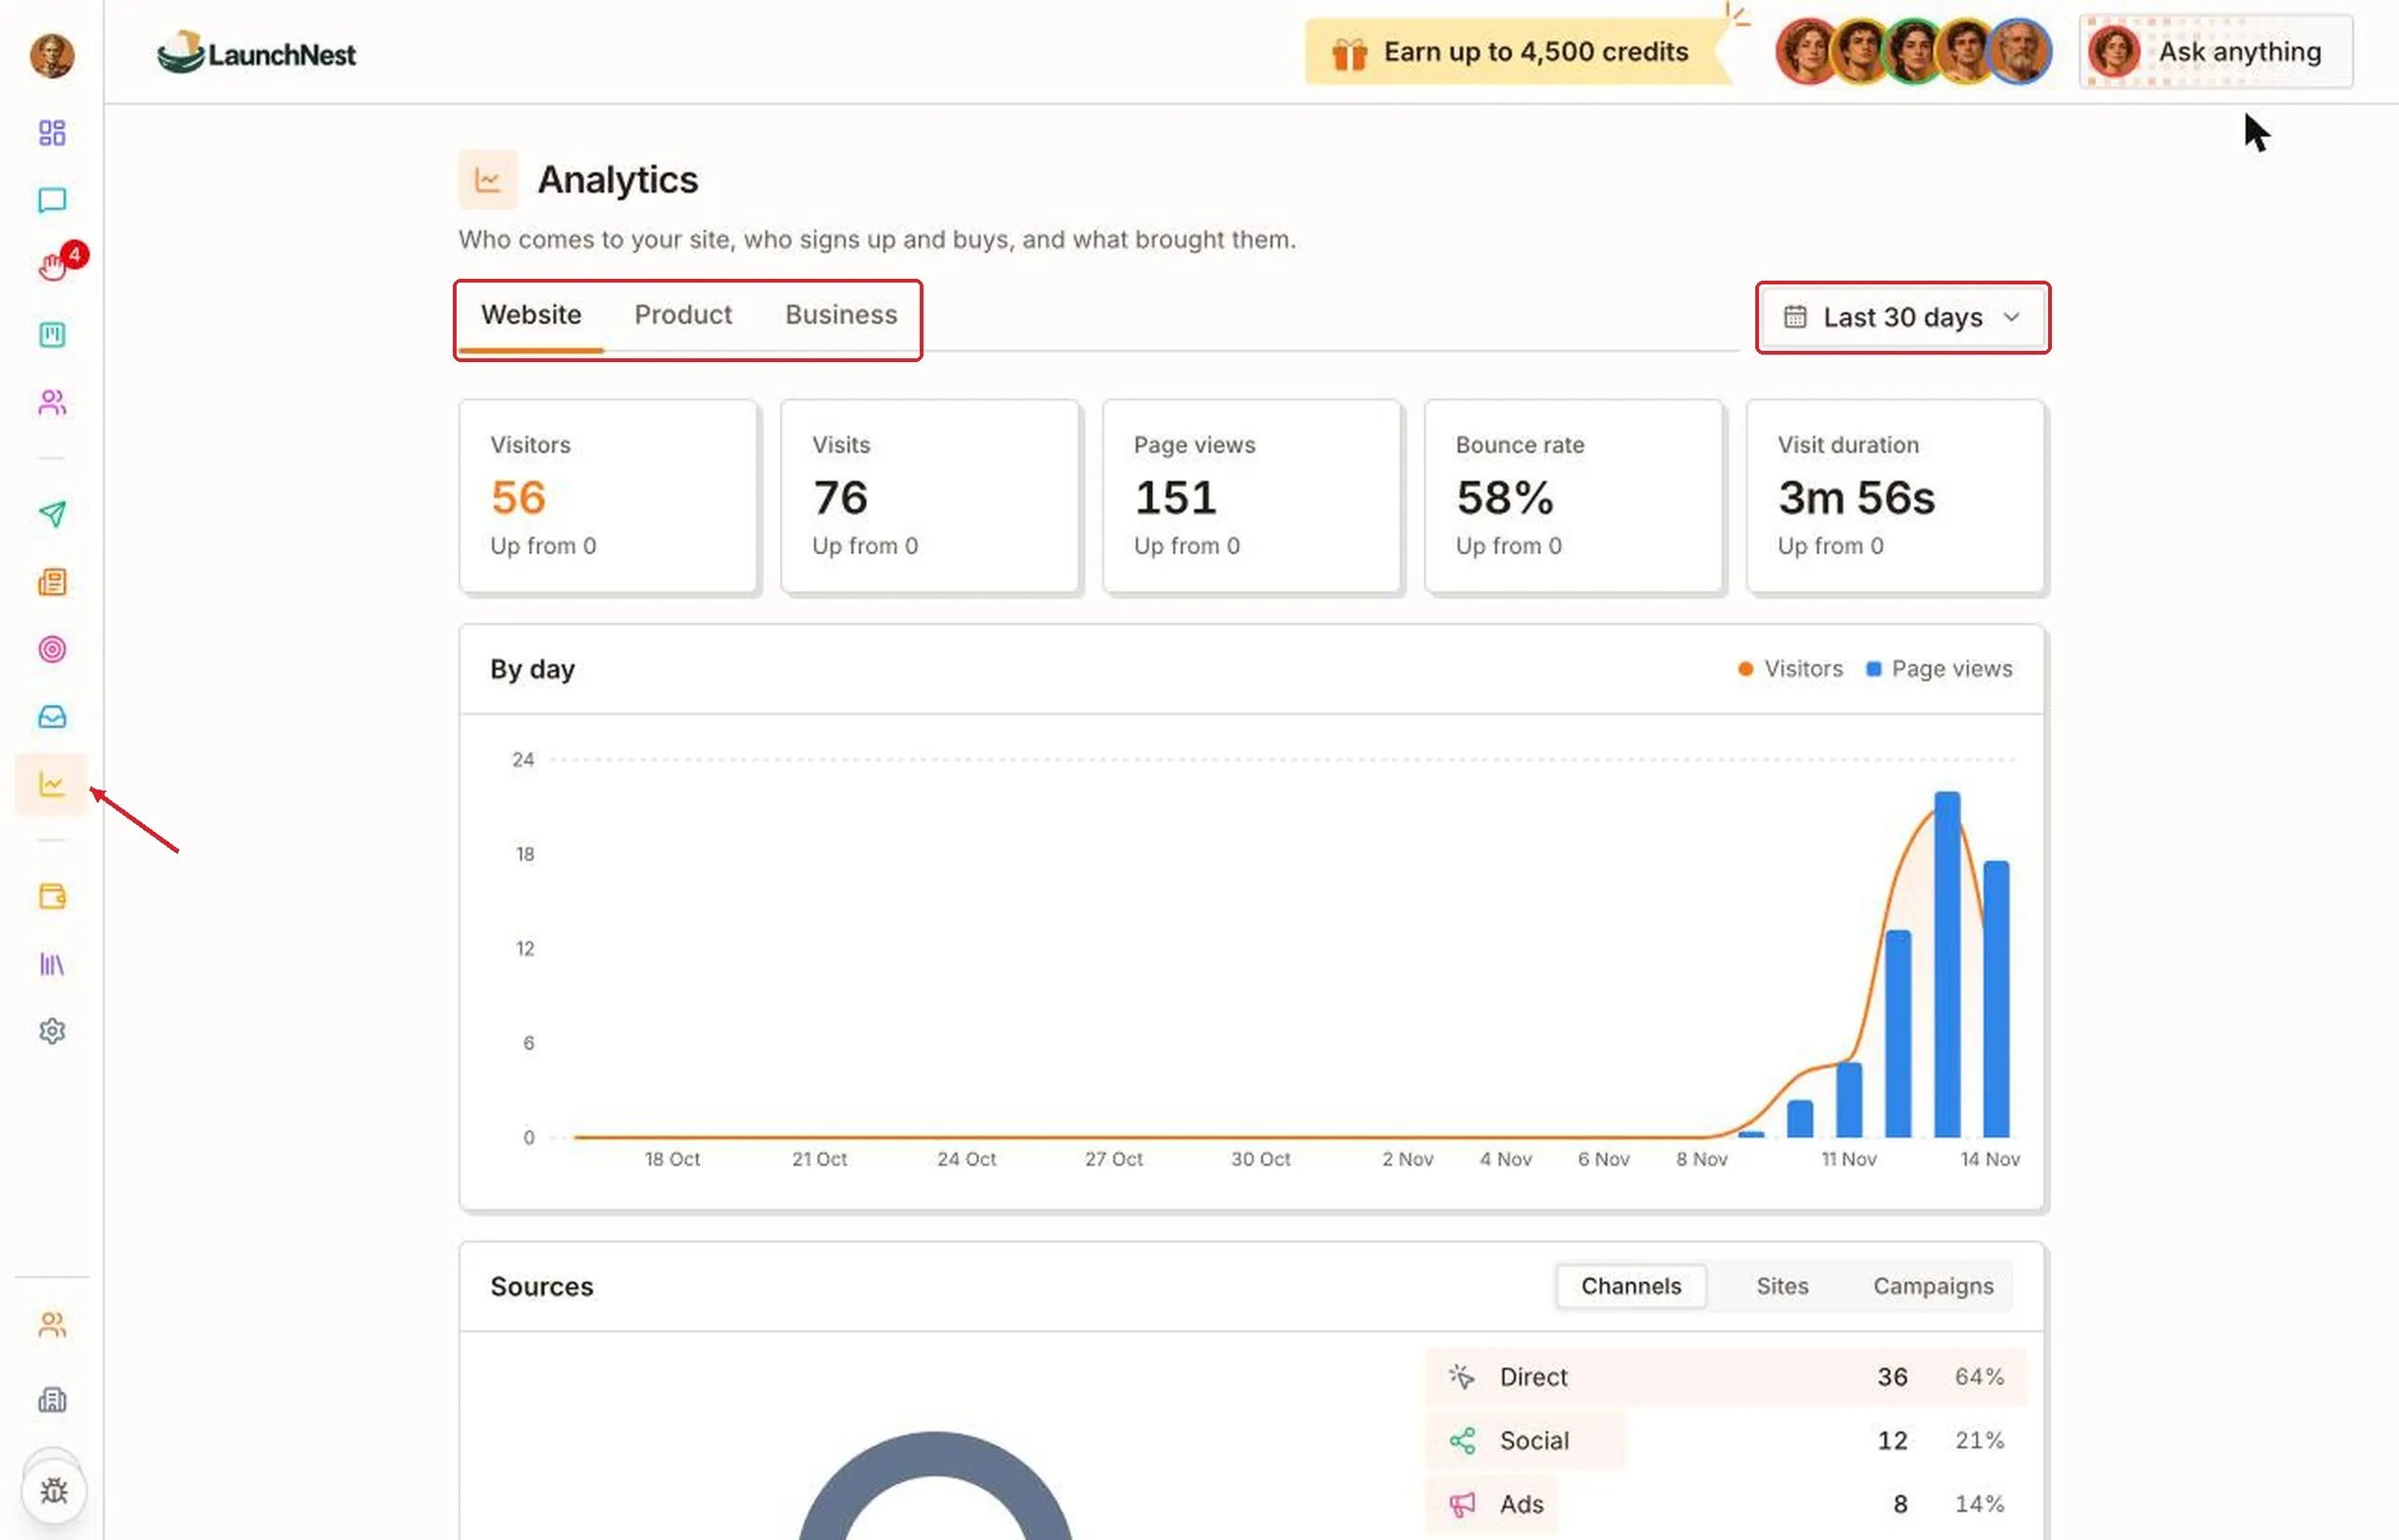
How do I change the dates?
Click the date range, like “Last 30 days”. Pick “Today”, “Yesterday”, “Last 7 days”, “Last 30 days”, “Last 90 days”, “This week” or “This month”, or choose your own days on the calendar and click “Apply”.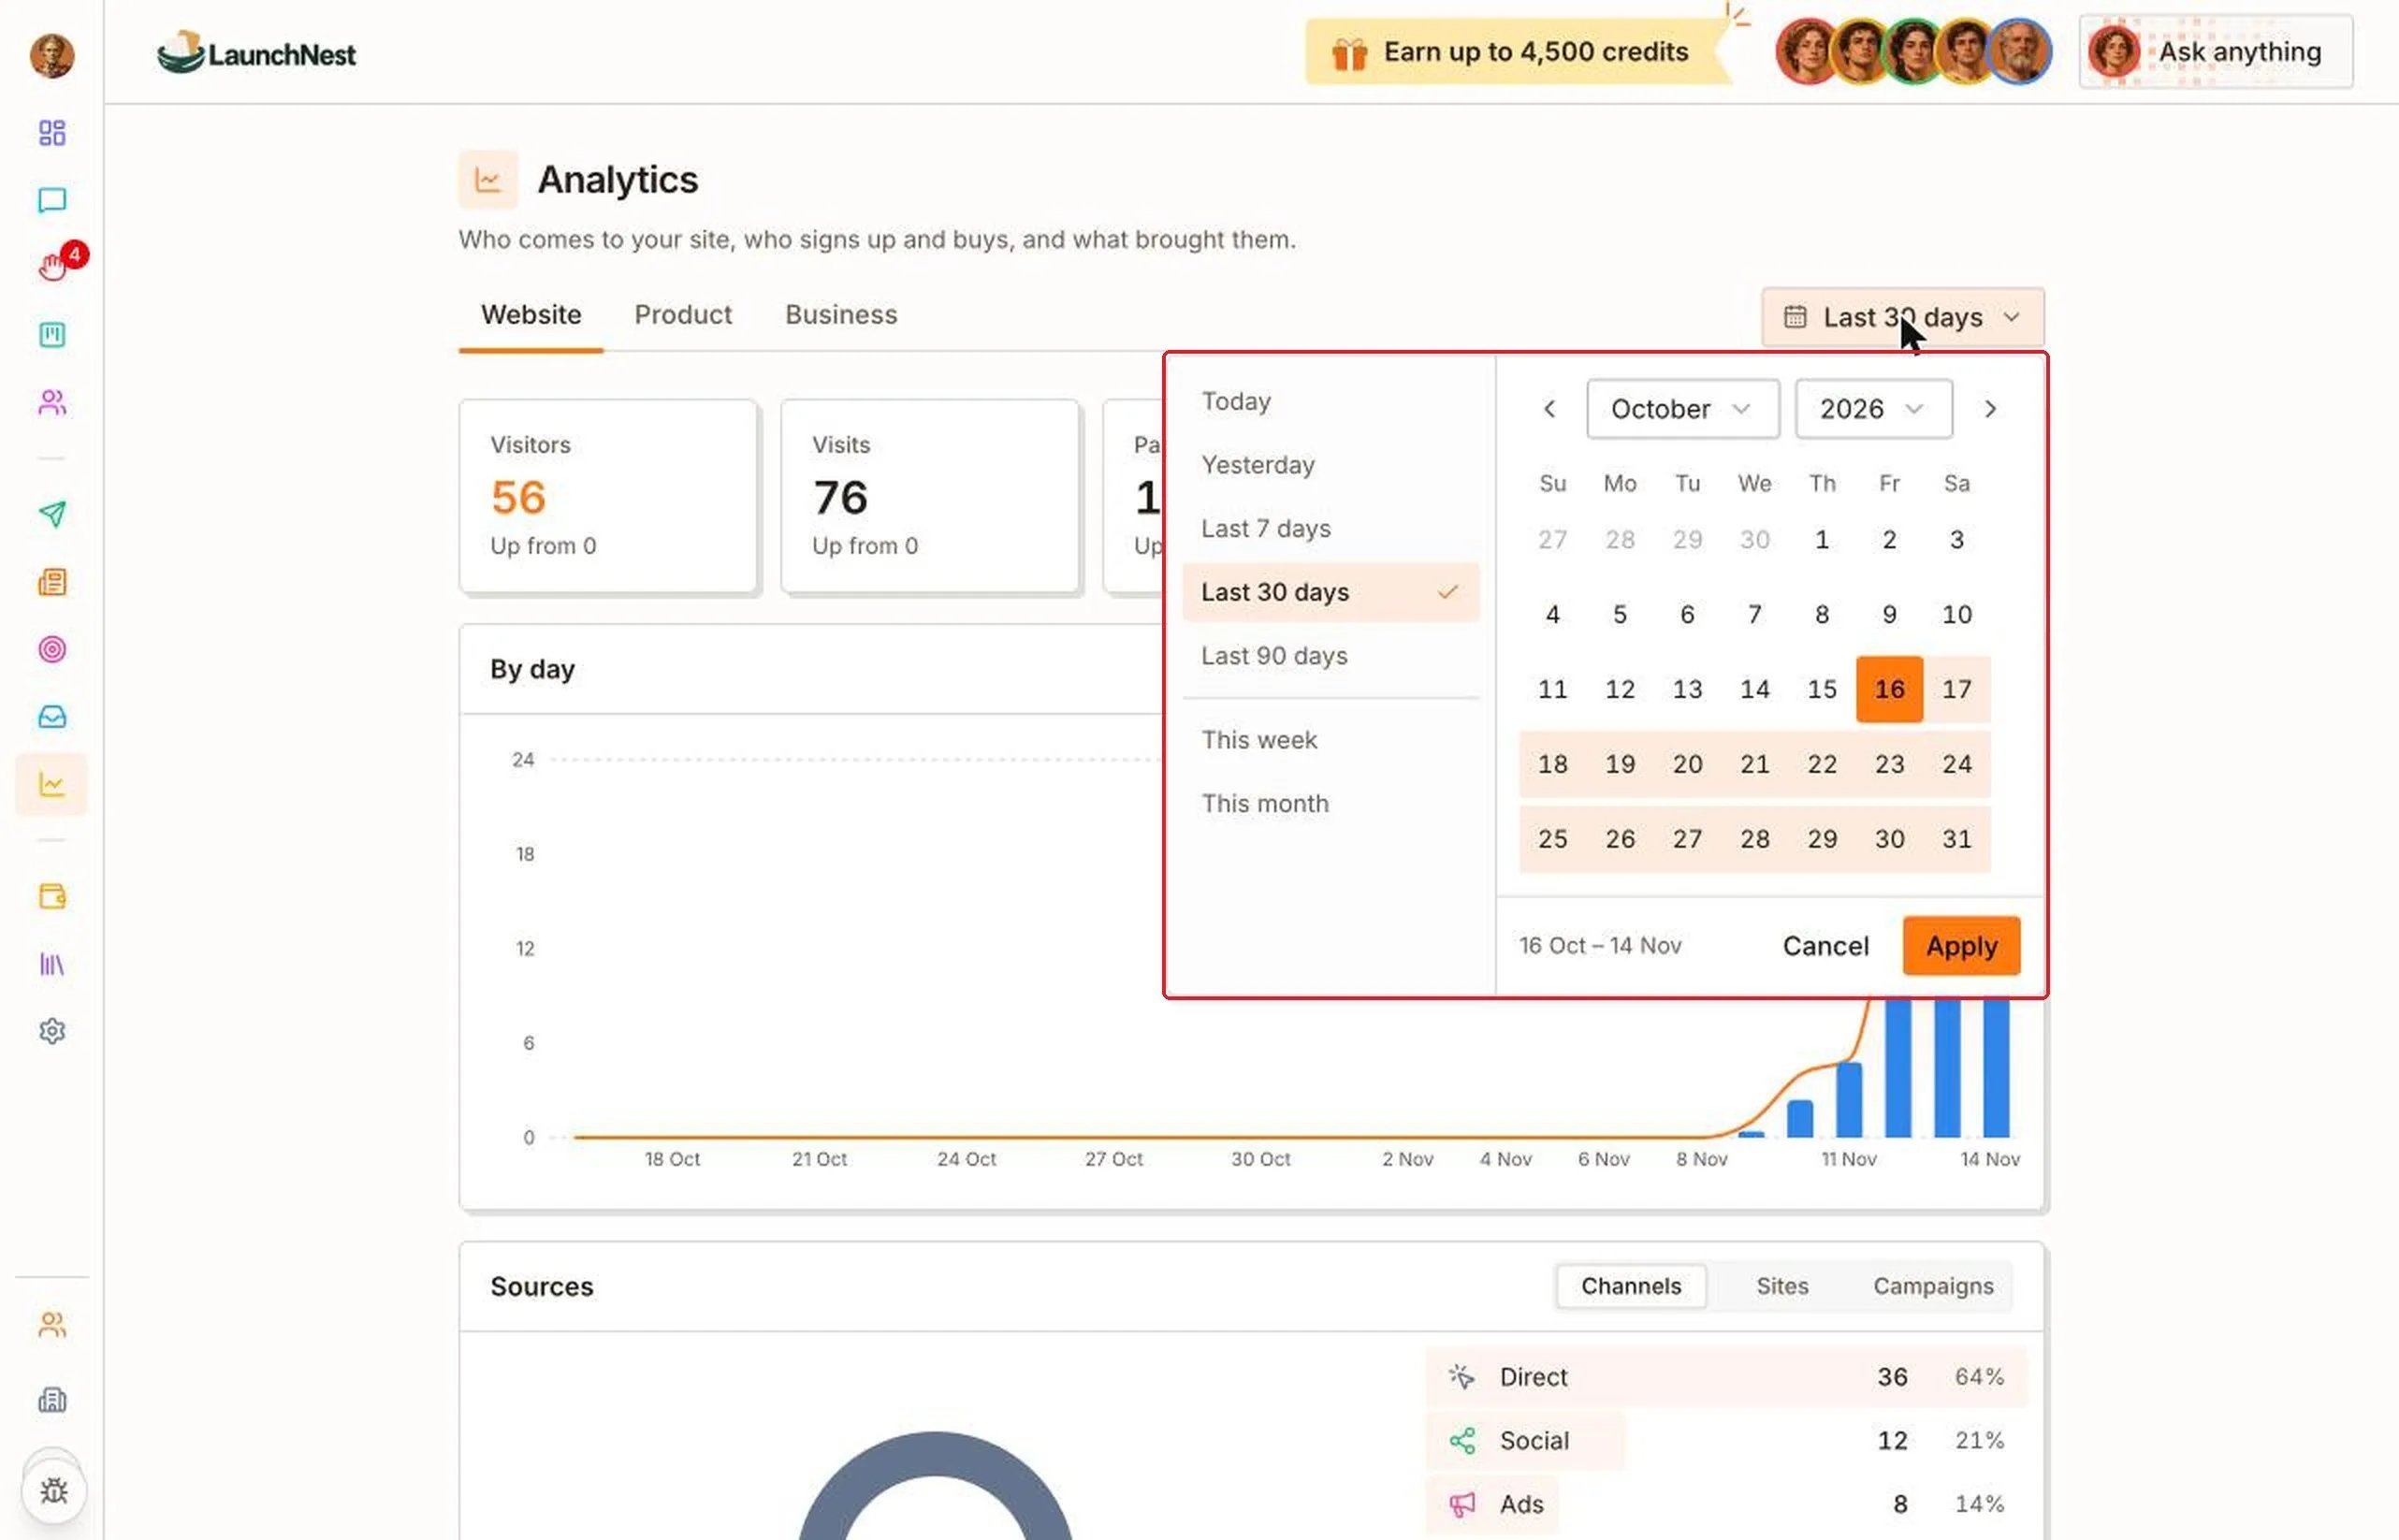
How many people visit my site?
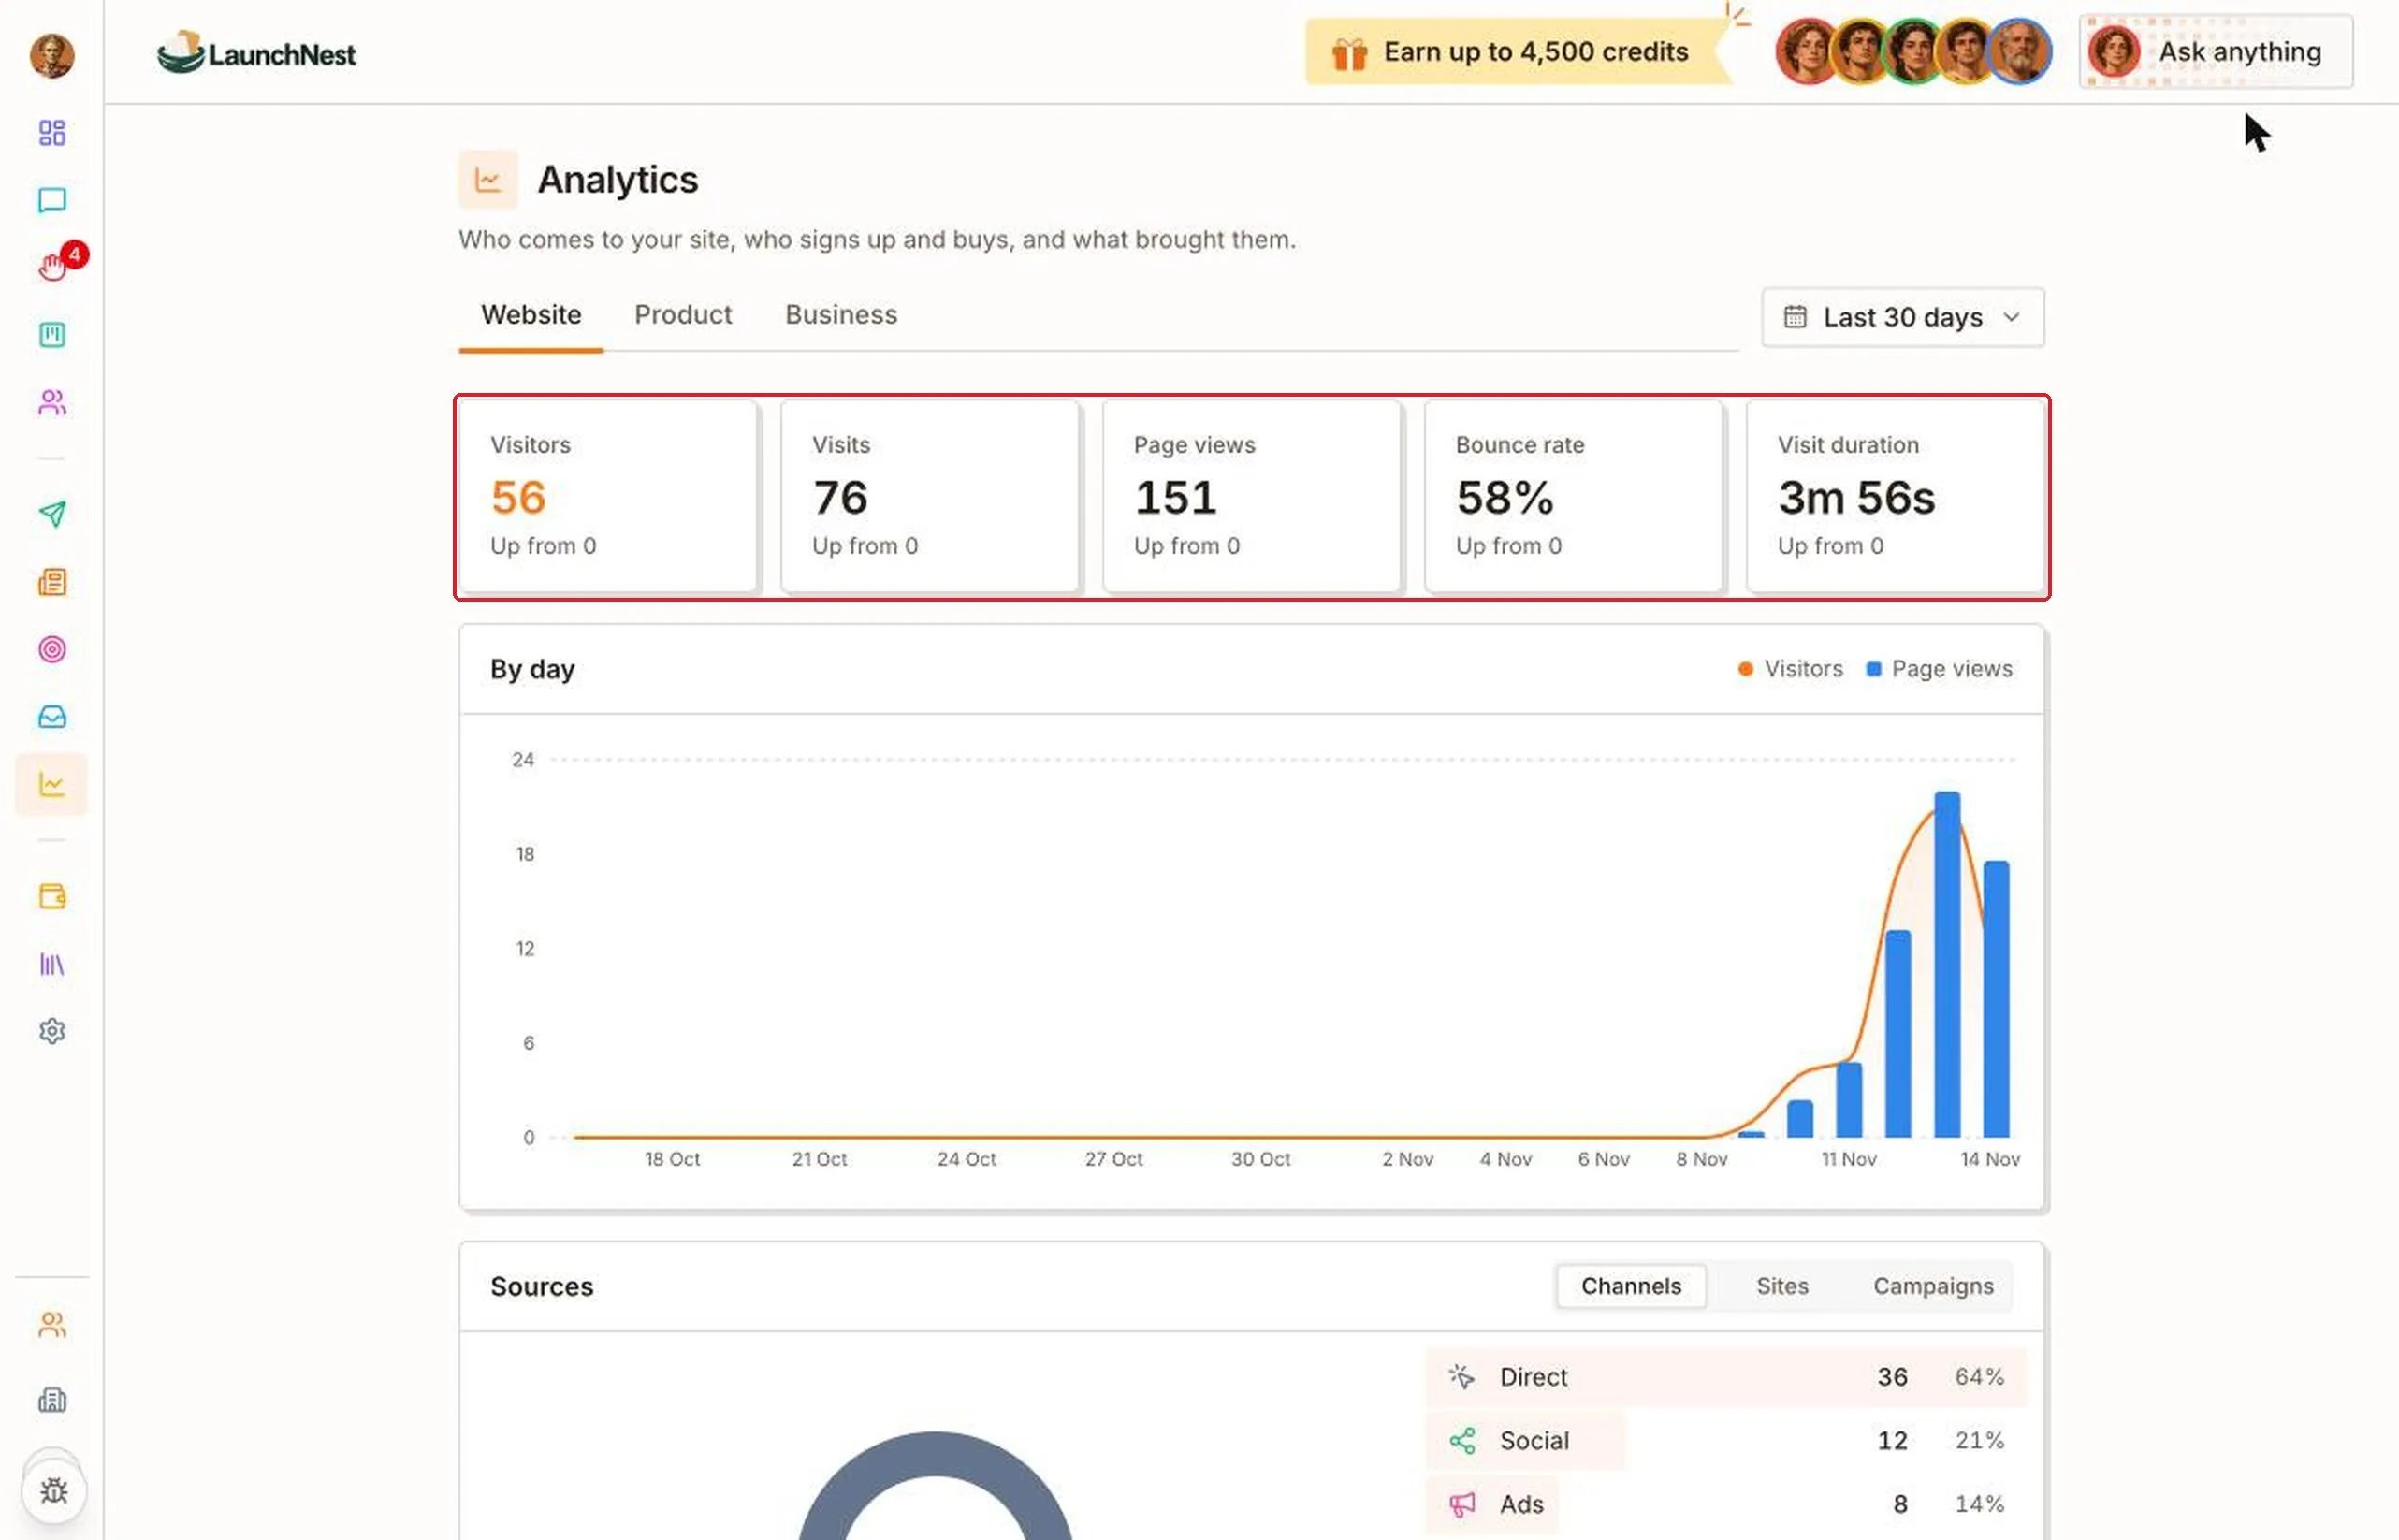
The “Website” tab starts with five numbers:- “Visitors”: how many different people came
- “Visits”: how many times they came
- “Page views”: how many pages they opened
- “Bounce rate”: how many left after one page
- “Visit duration”: how long they stayed
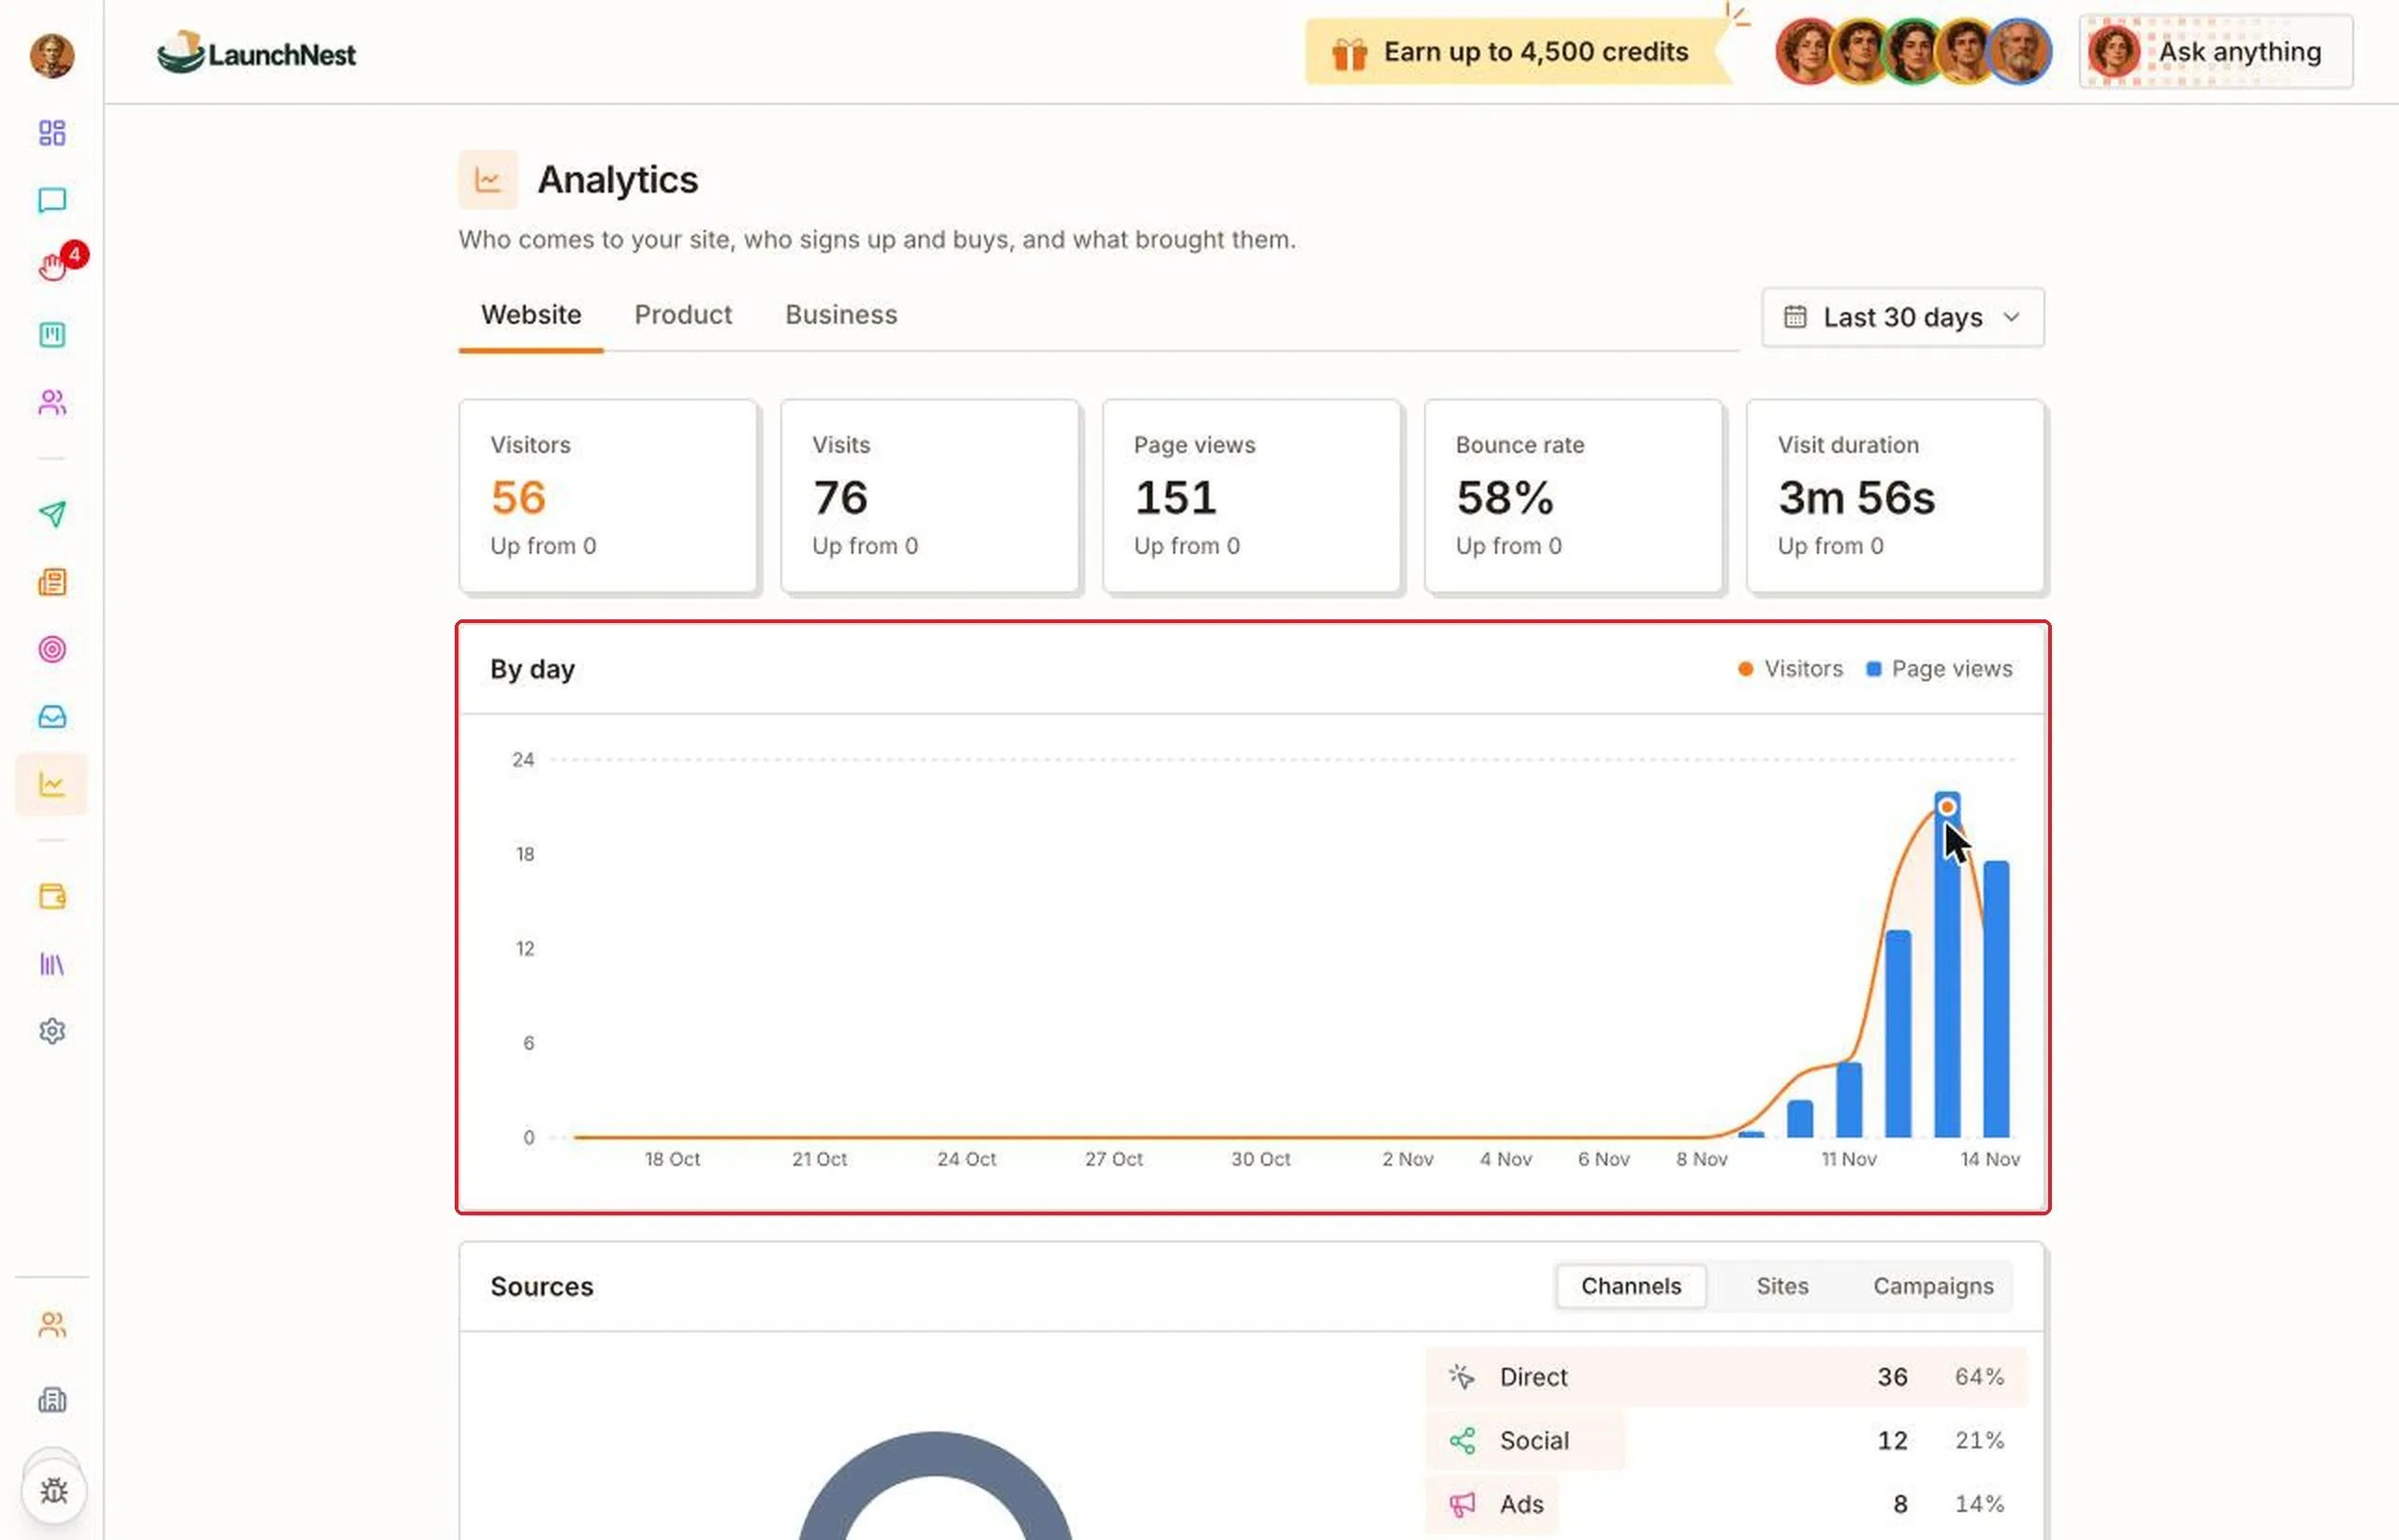
Where do my visitors come from?
“Sources” shows how people found your site, like “Direct”, “Social” or “Ads”.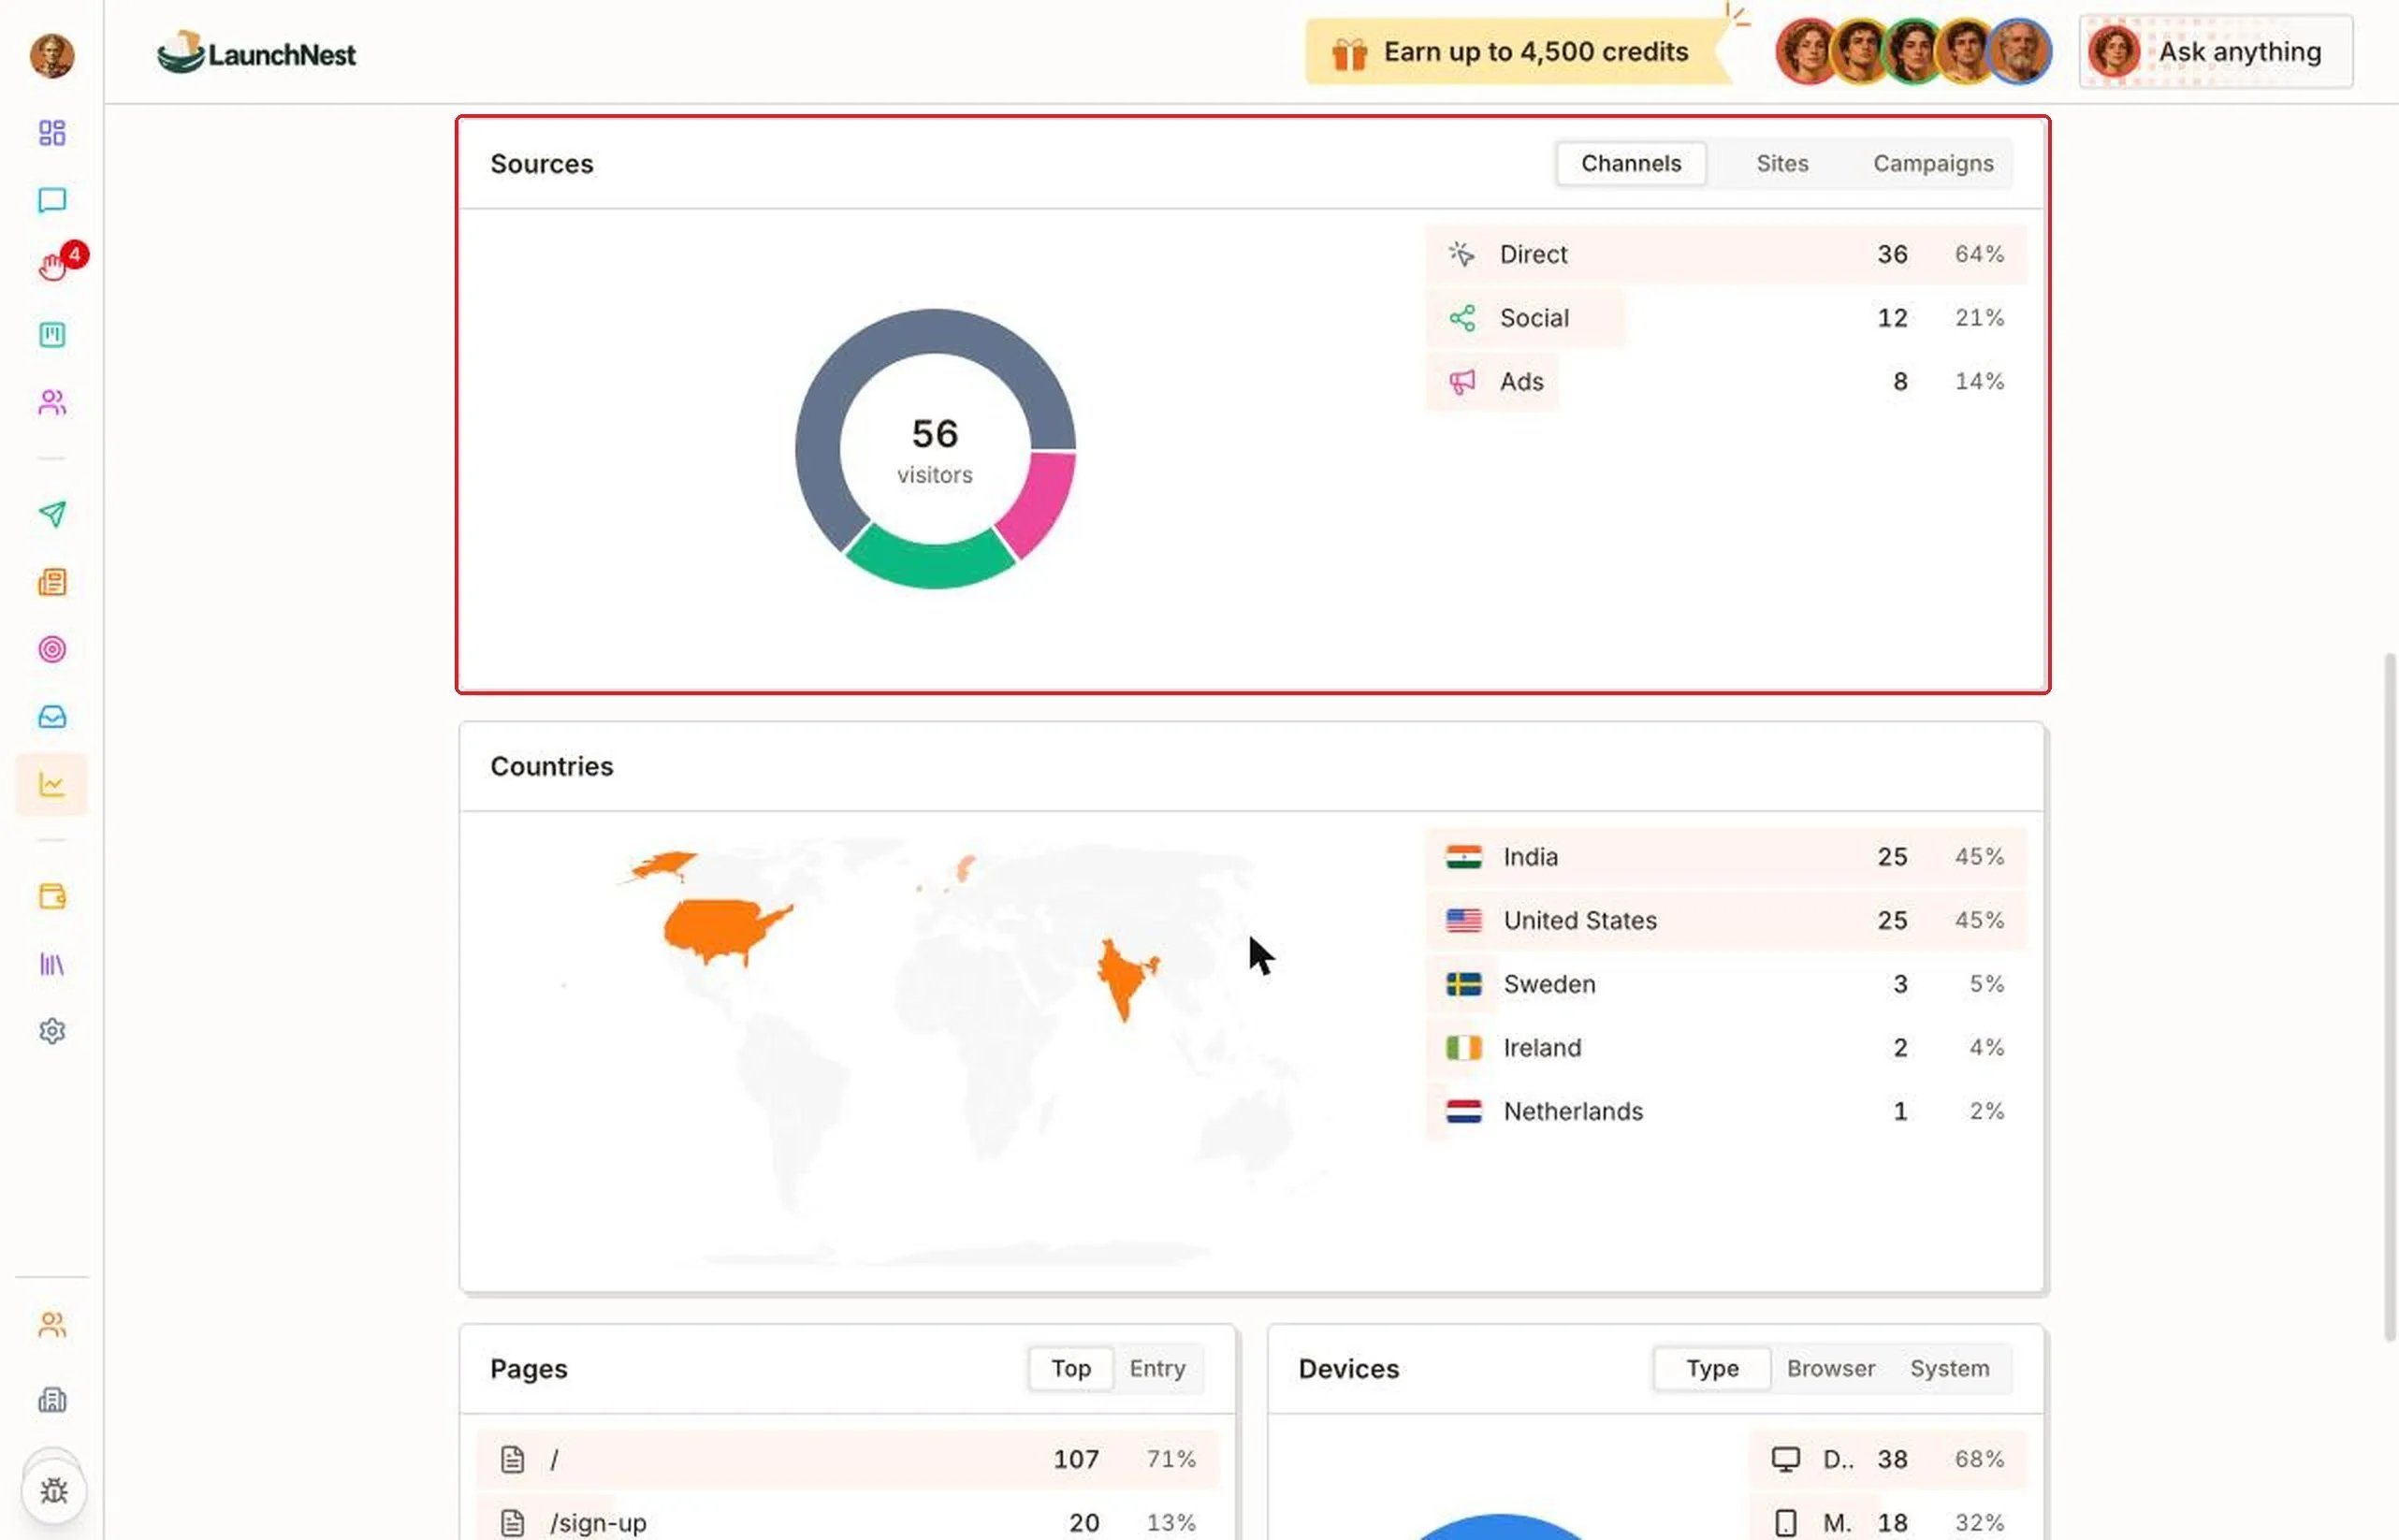
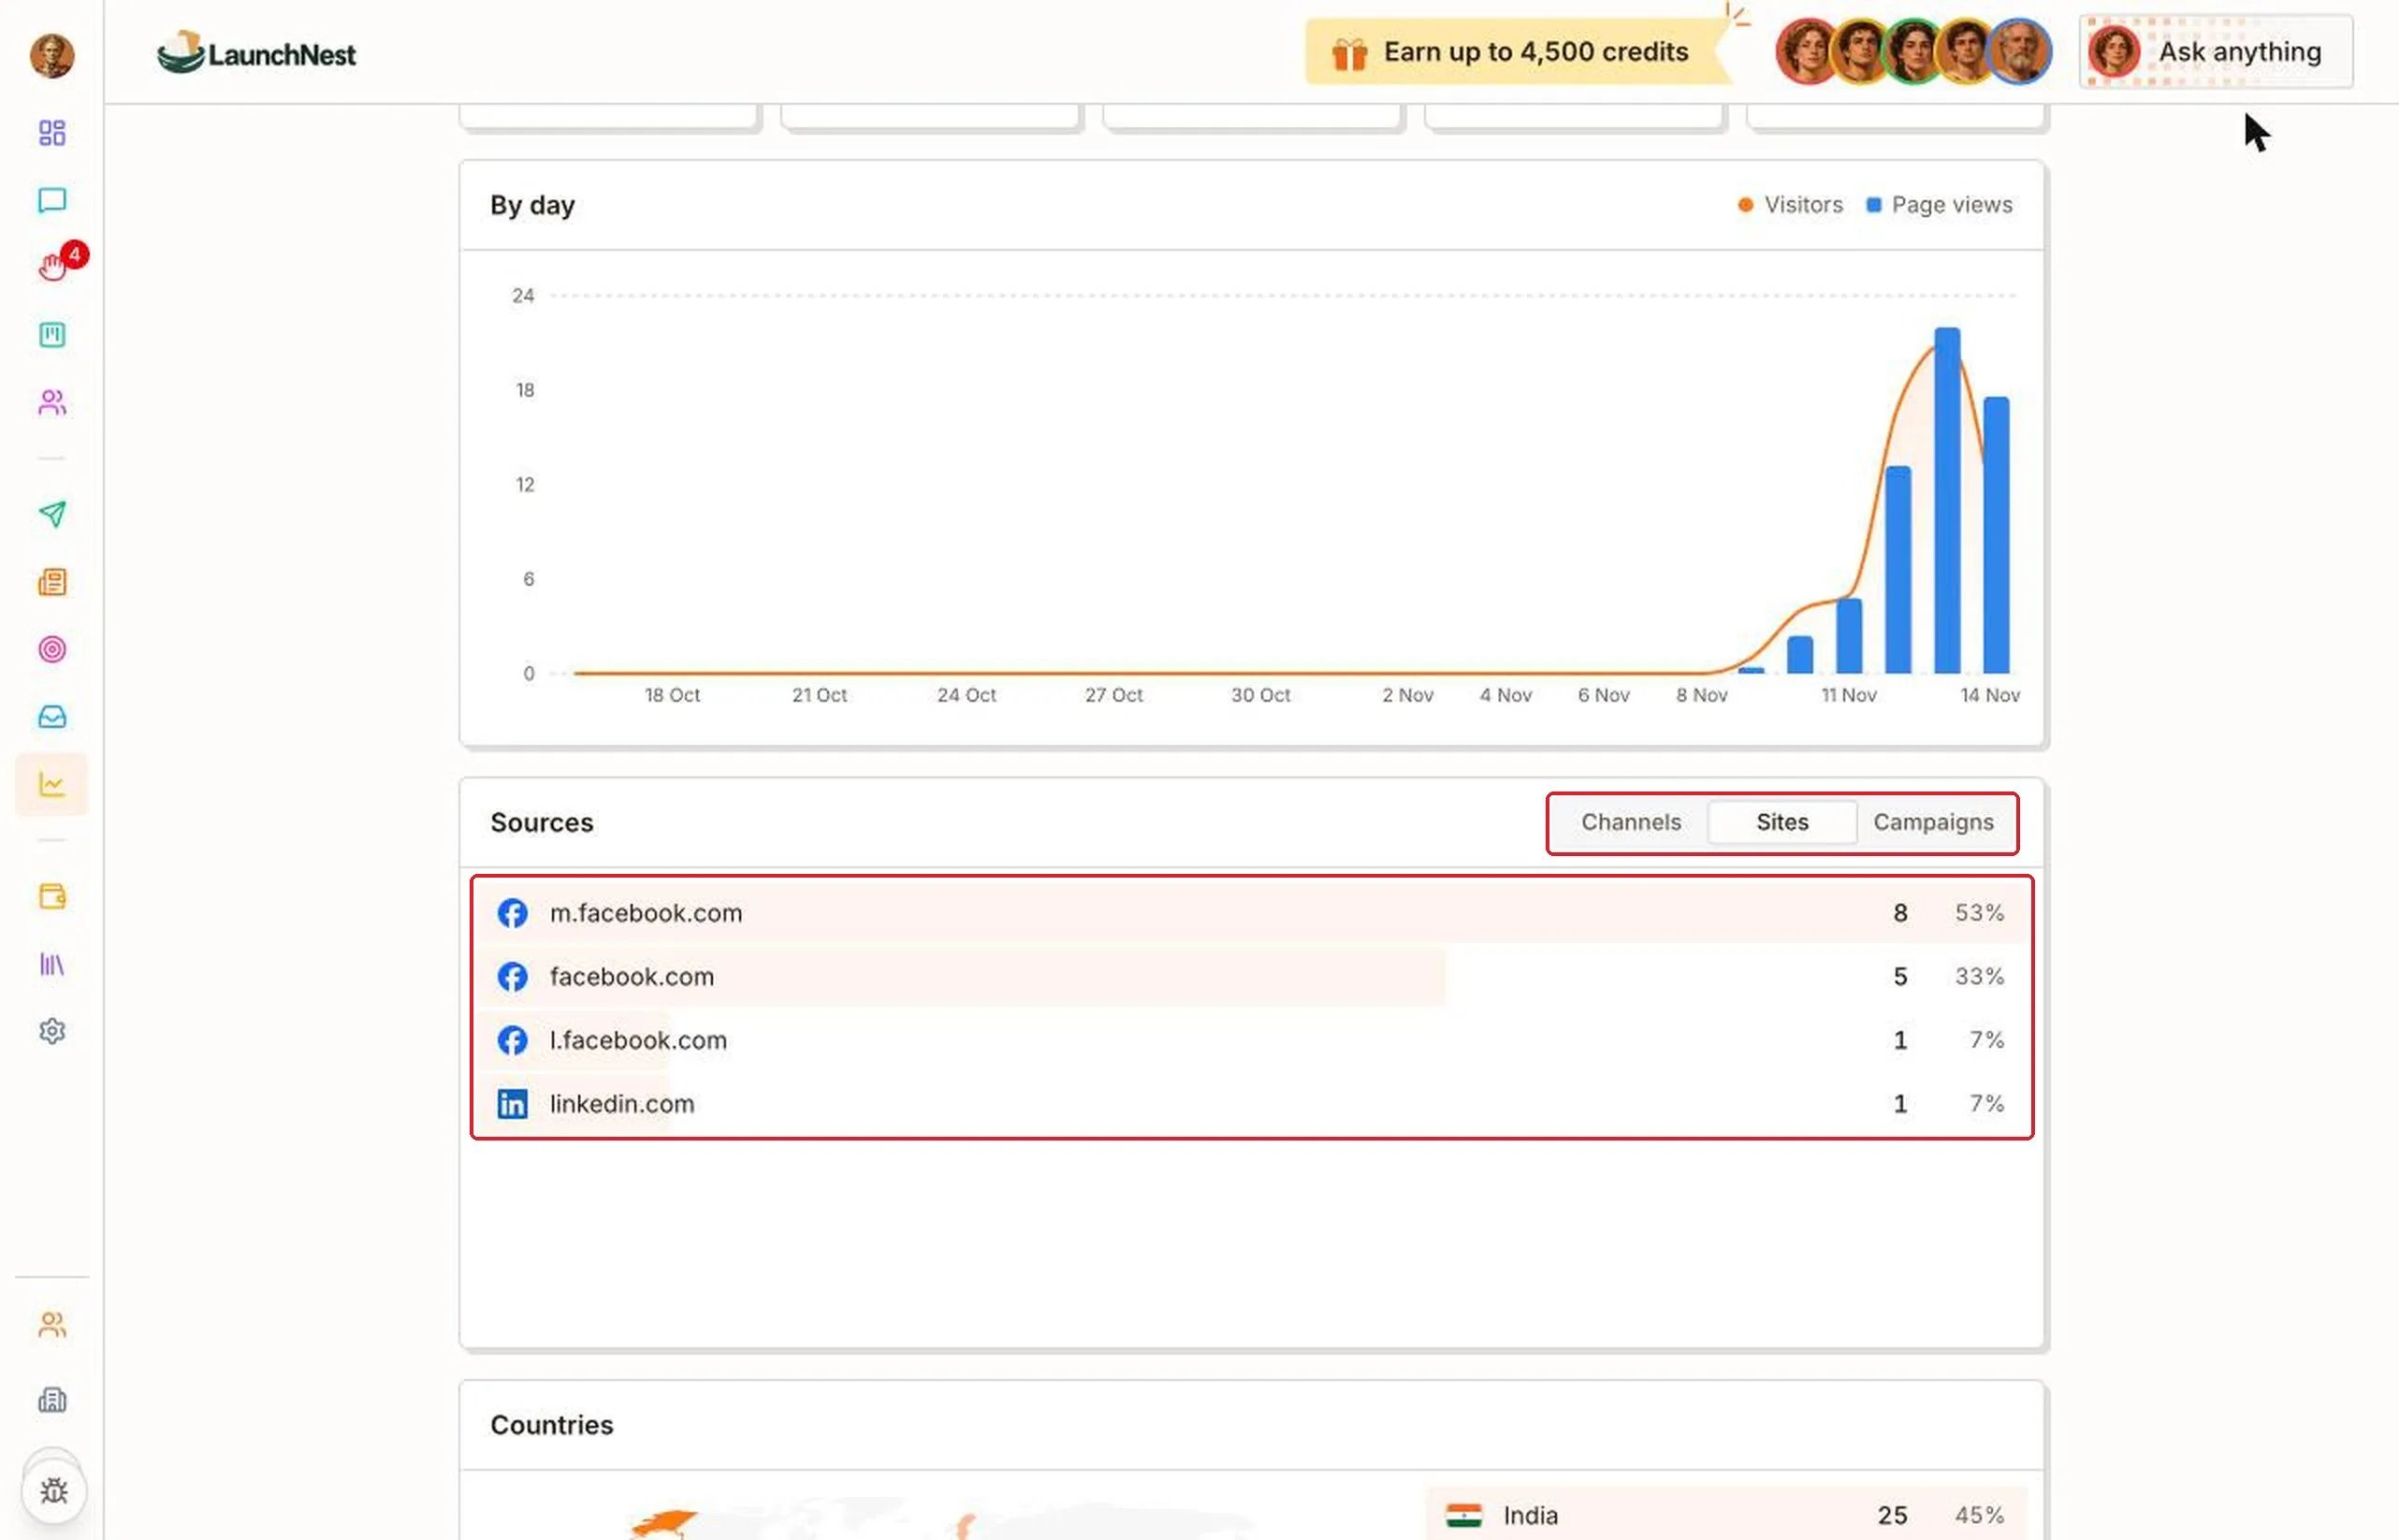
Tip: Check “Sources” once a week. It tells you which channel is working, so you can ask the CEO to do more of it.
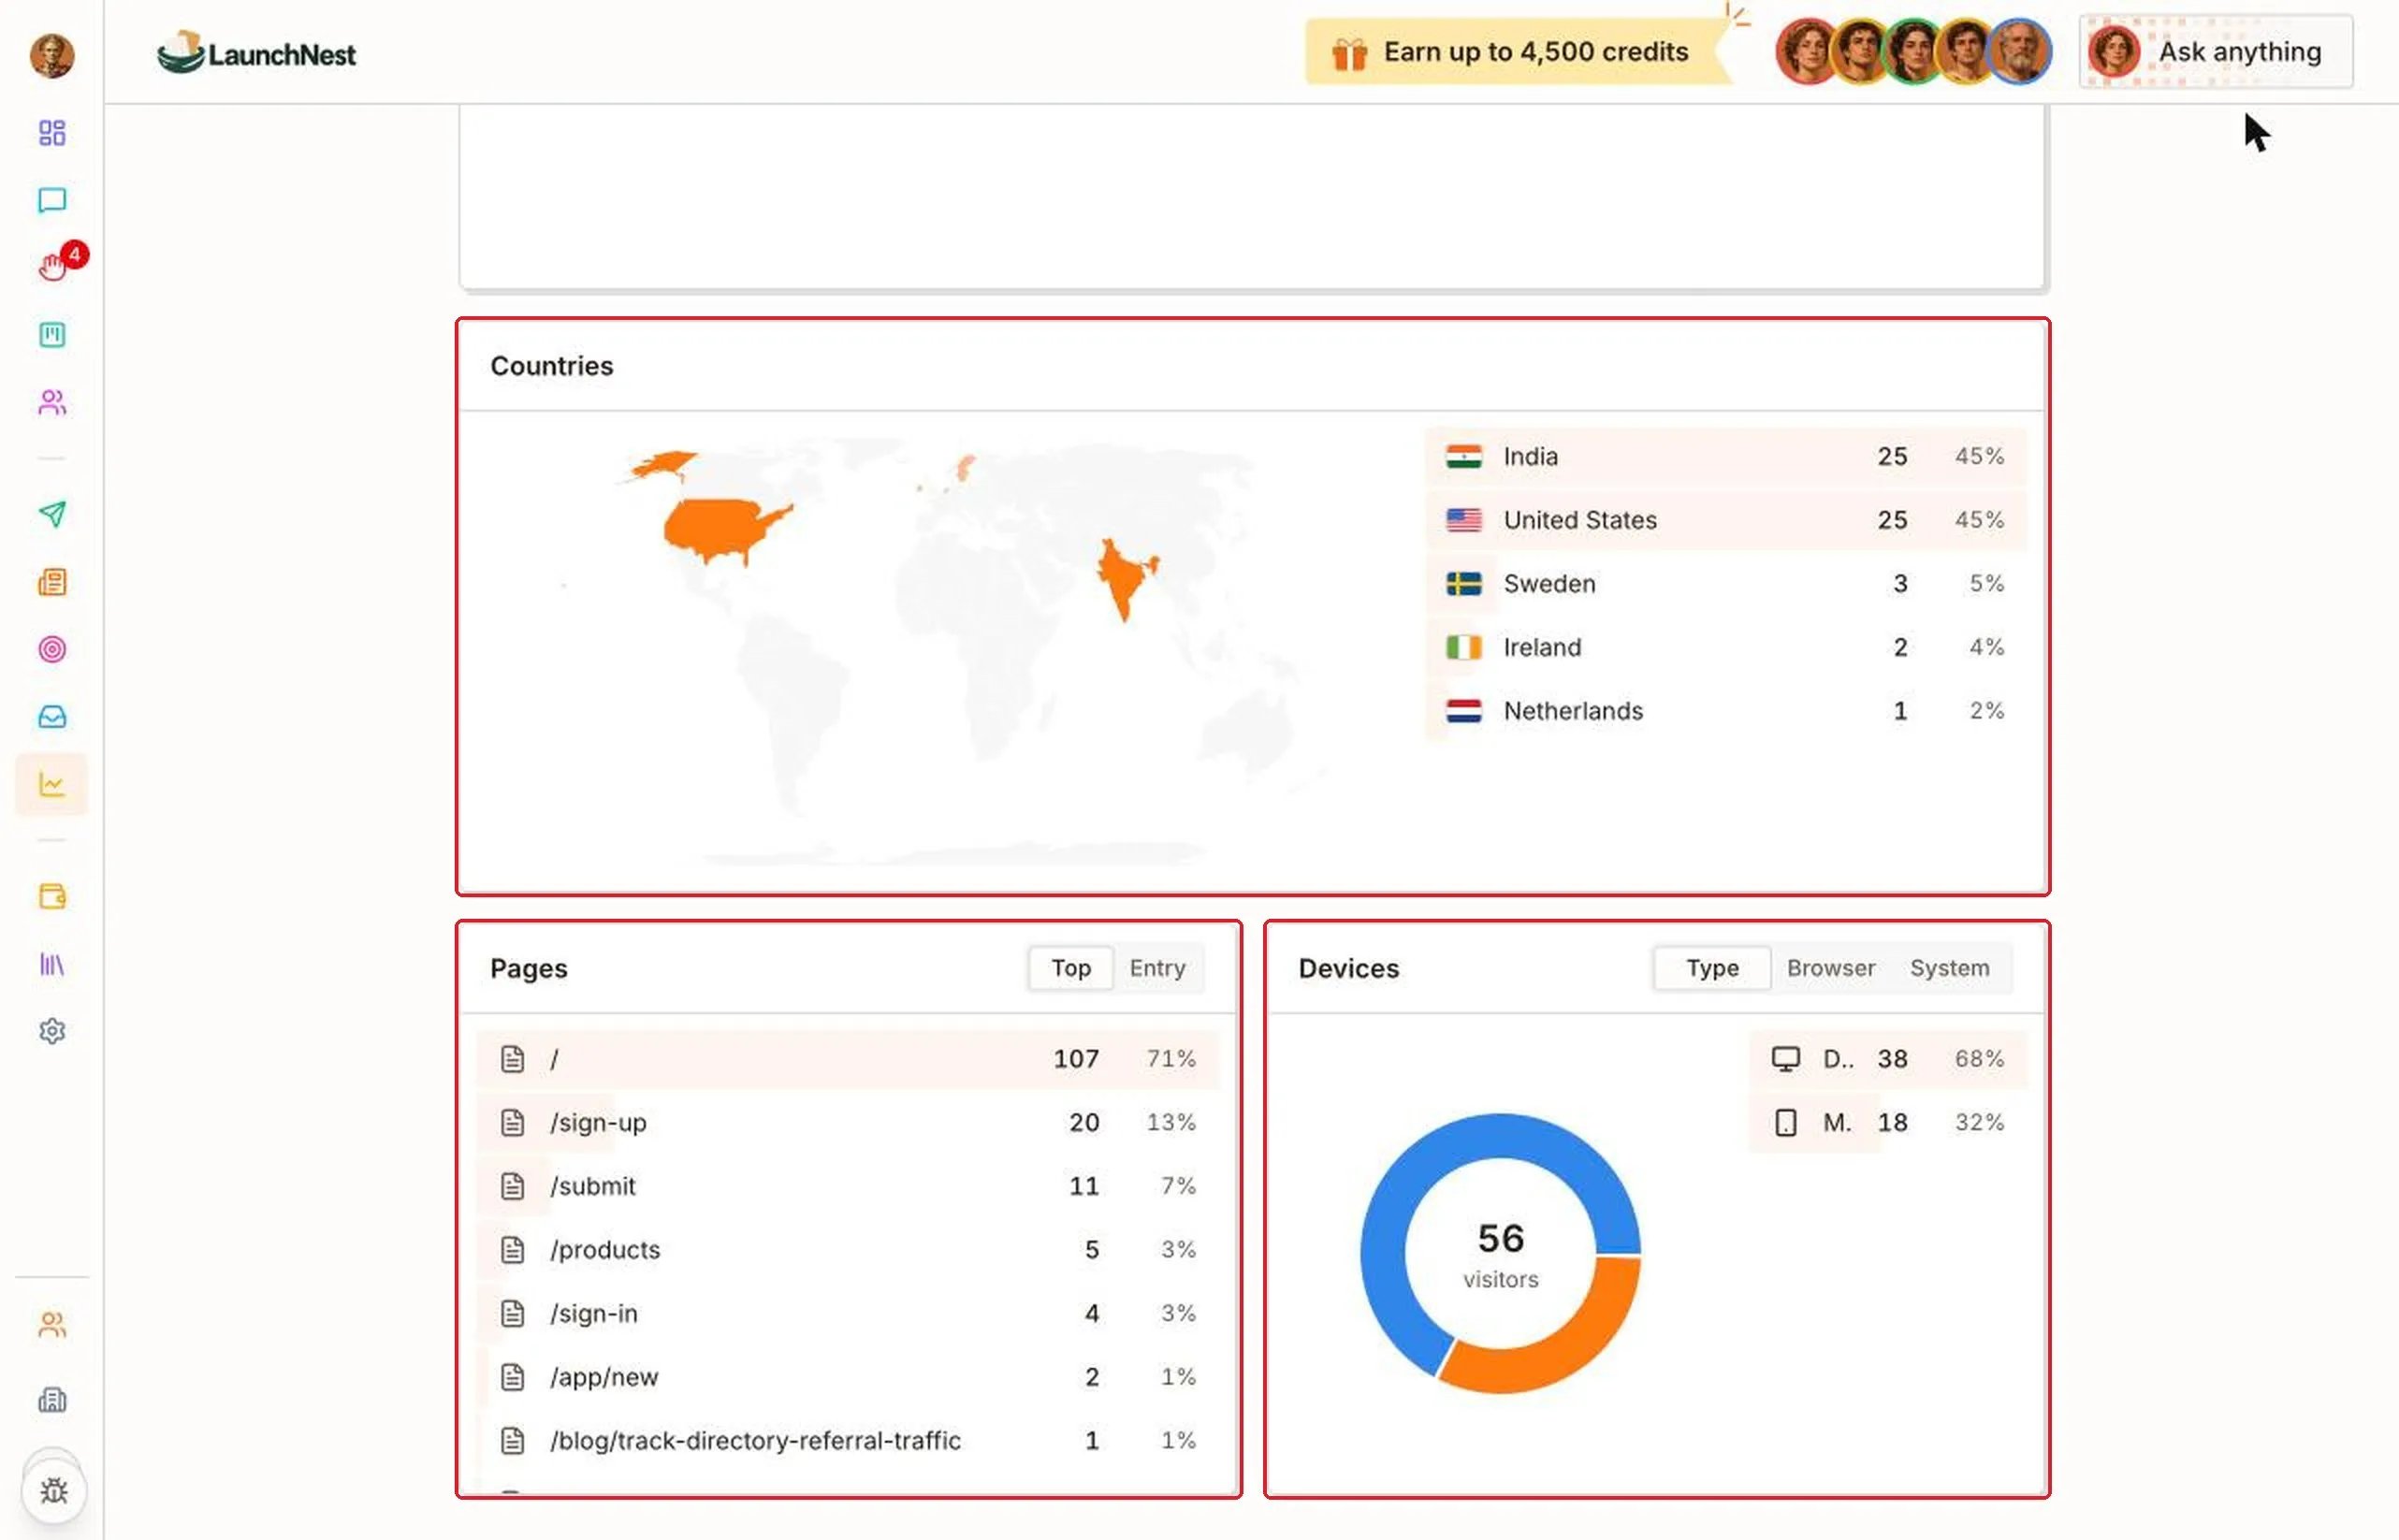
Which countries, pages and devices?
Further down:- “Countries”: where your visitors are
- “Pages”: which pages they open most (“Top”) or land on first (“Entry”)
- “Devices”: computer or phone (“Type”), plus “Browser” and “System”
Are people signing up and buying?
Open “Product”. It shows “Signups”, “Signup rate” (out of all visitors), “Purchases”, “New subscribers” and “Revenue”. “What sold” lists what people bought.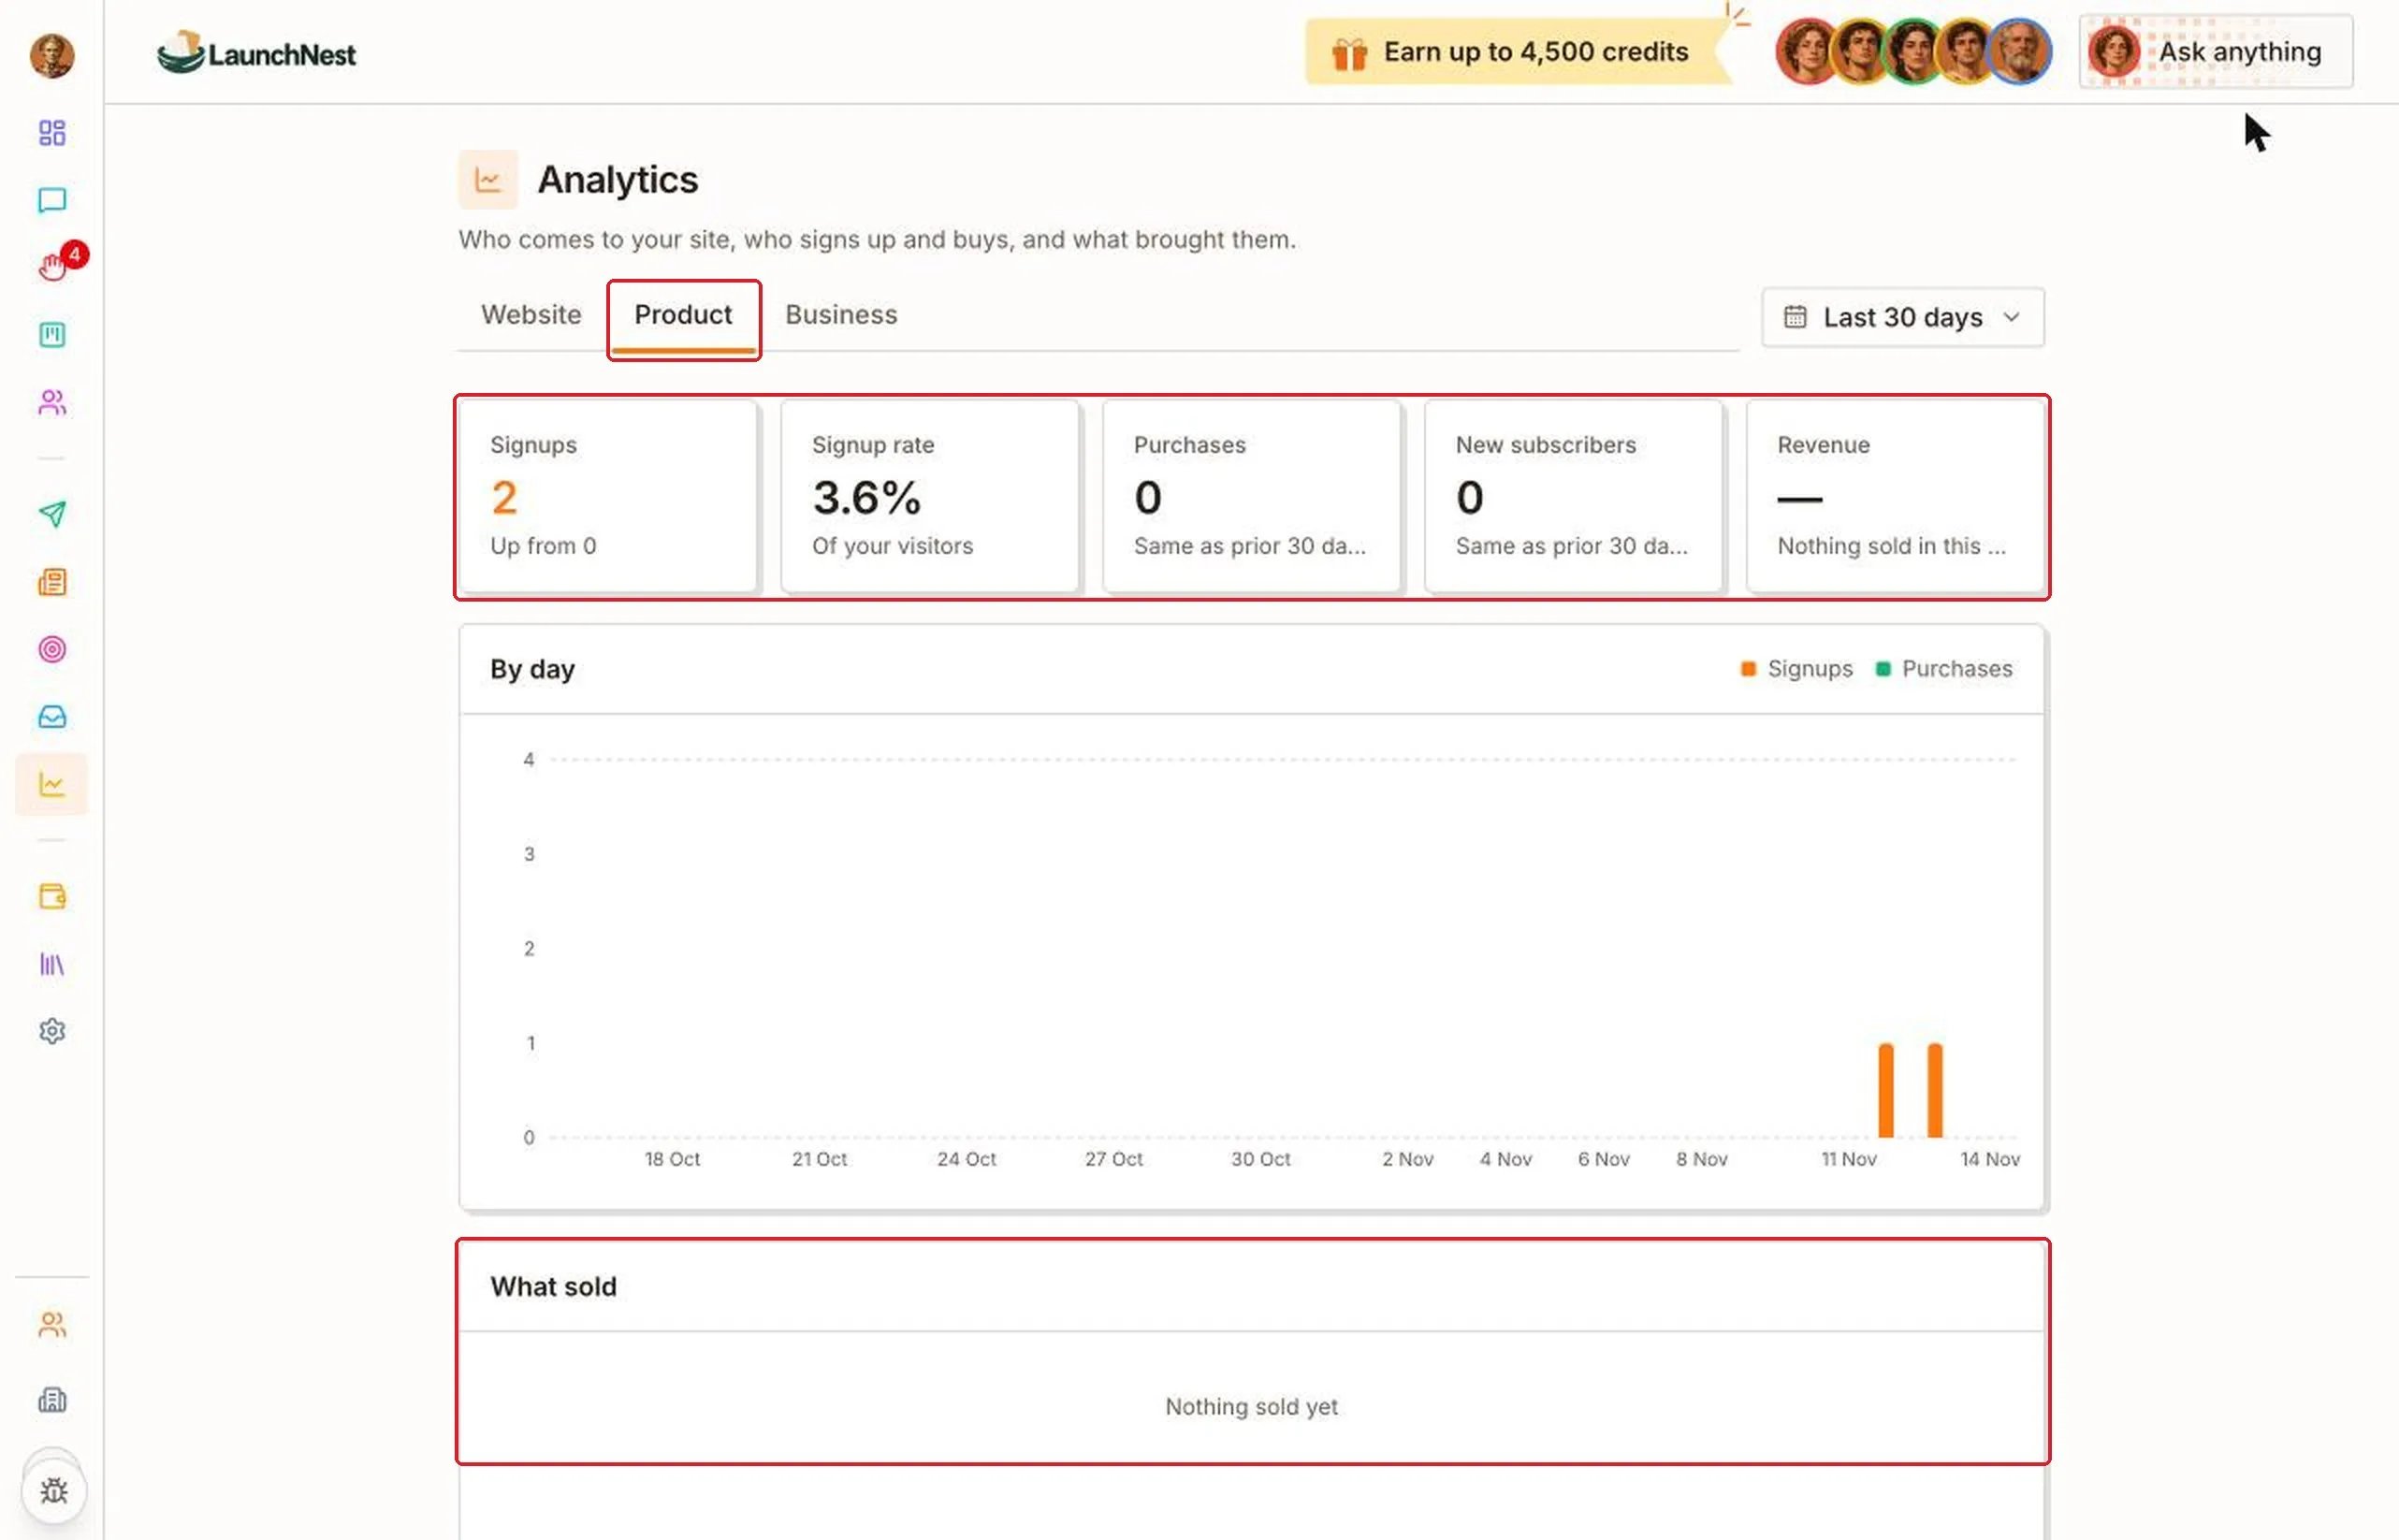
Which work is paying off?
Open “Business”. It shows each channel side by side:- “Ads”: spend, clicks, visitors from ads and cost per visitor
- “Outreach”: emails sent, replies, reply rate and visitors from email
- “Socials”: posts published, scheduled and visitors from social
- “Blog”: articles published, blog views and visitors from search
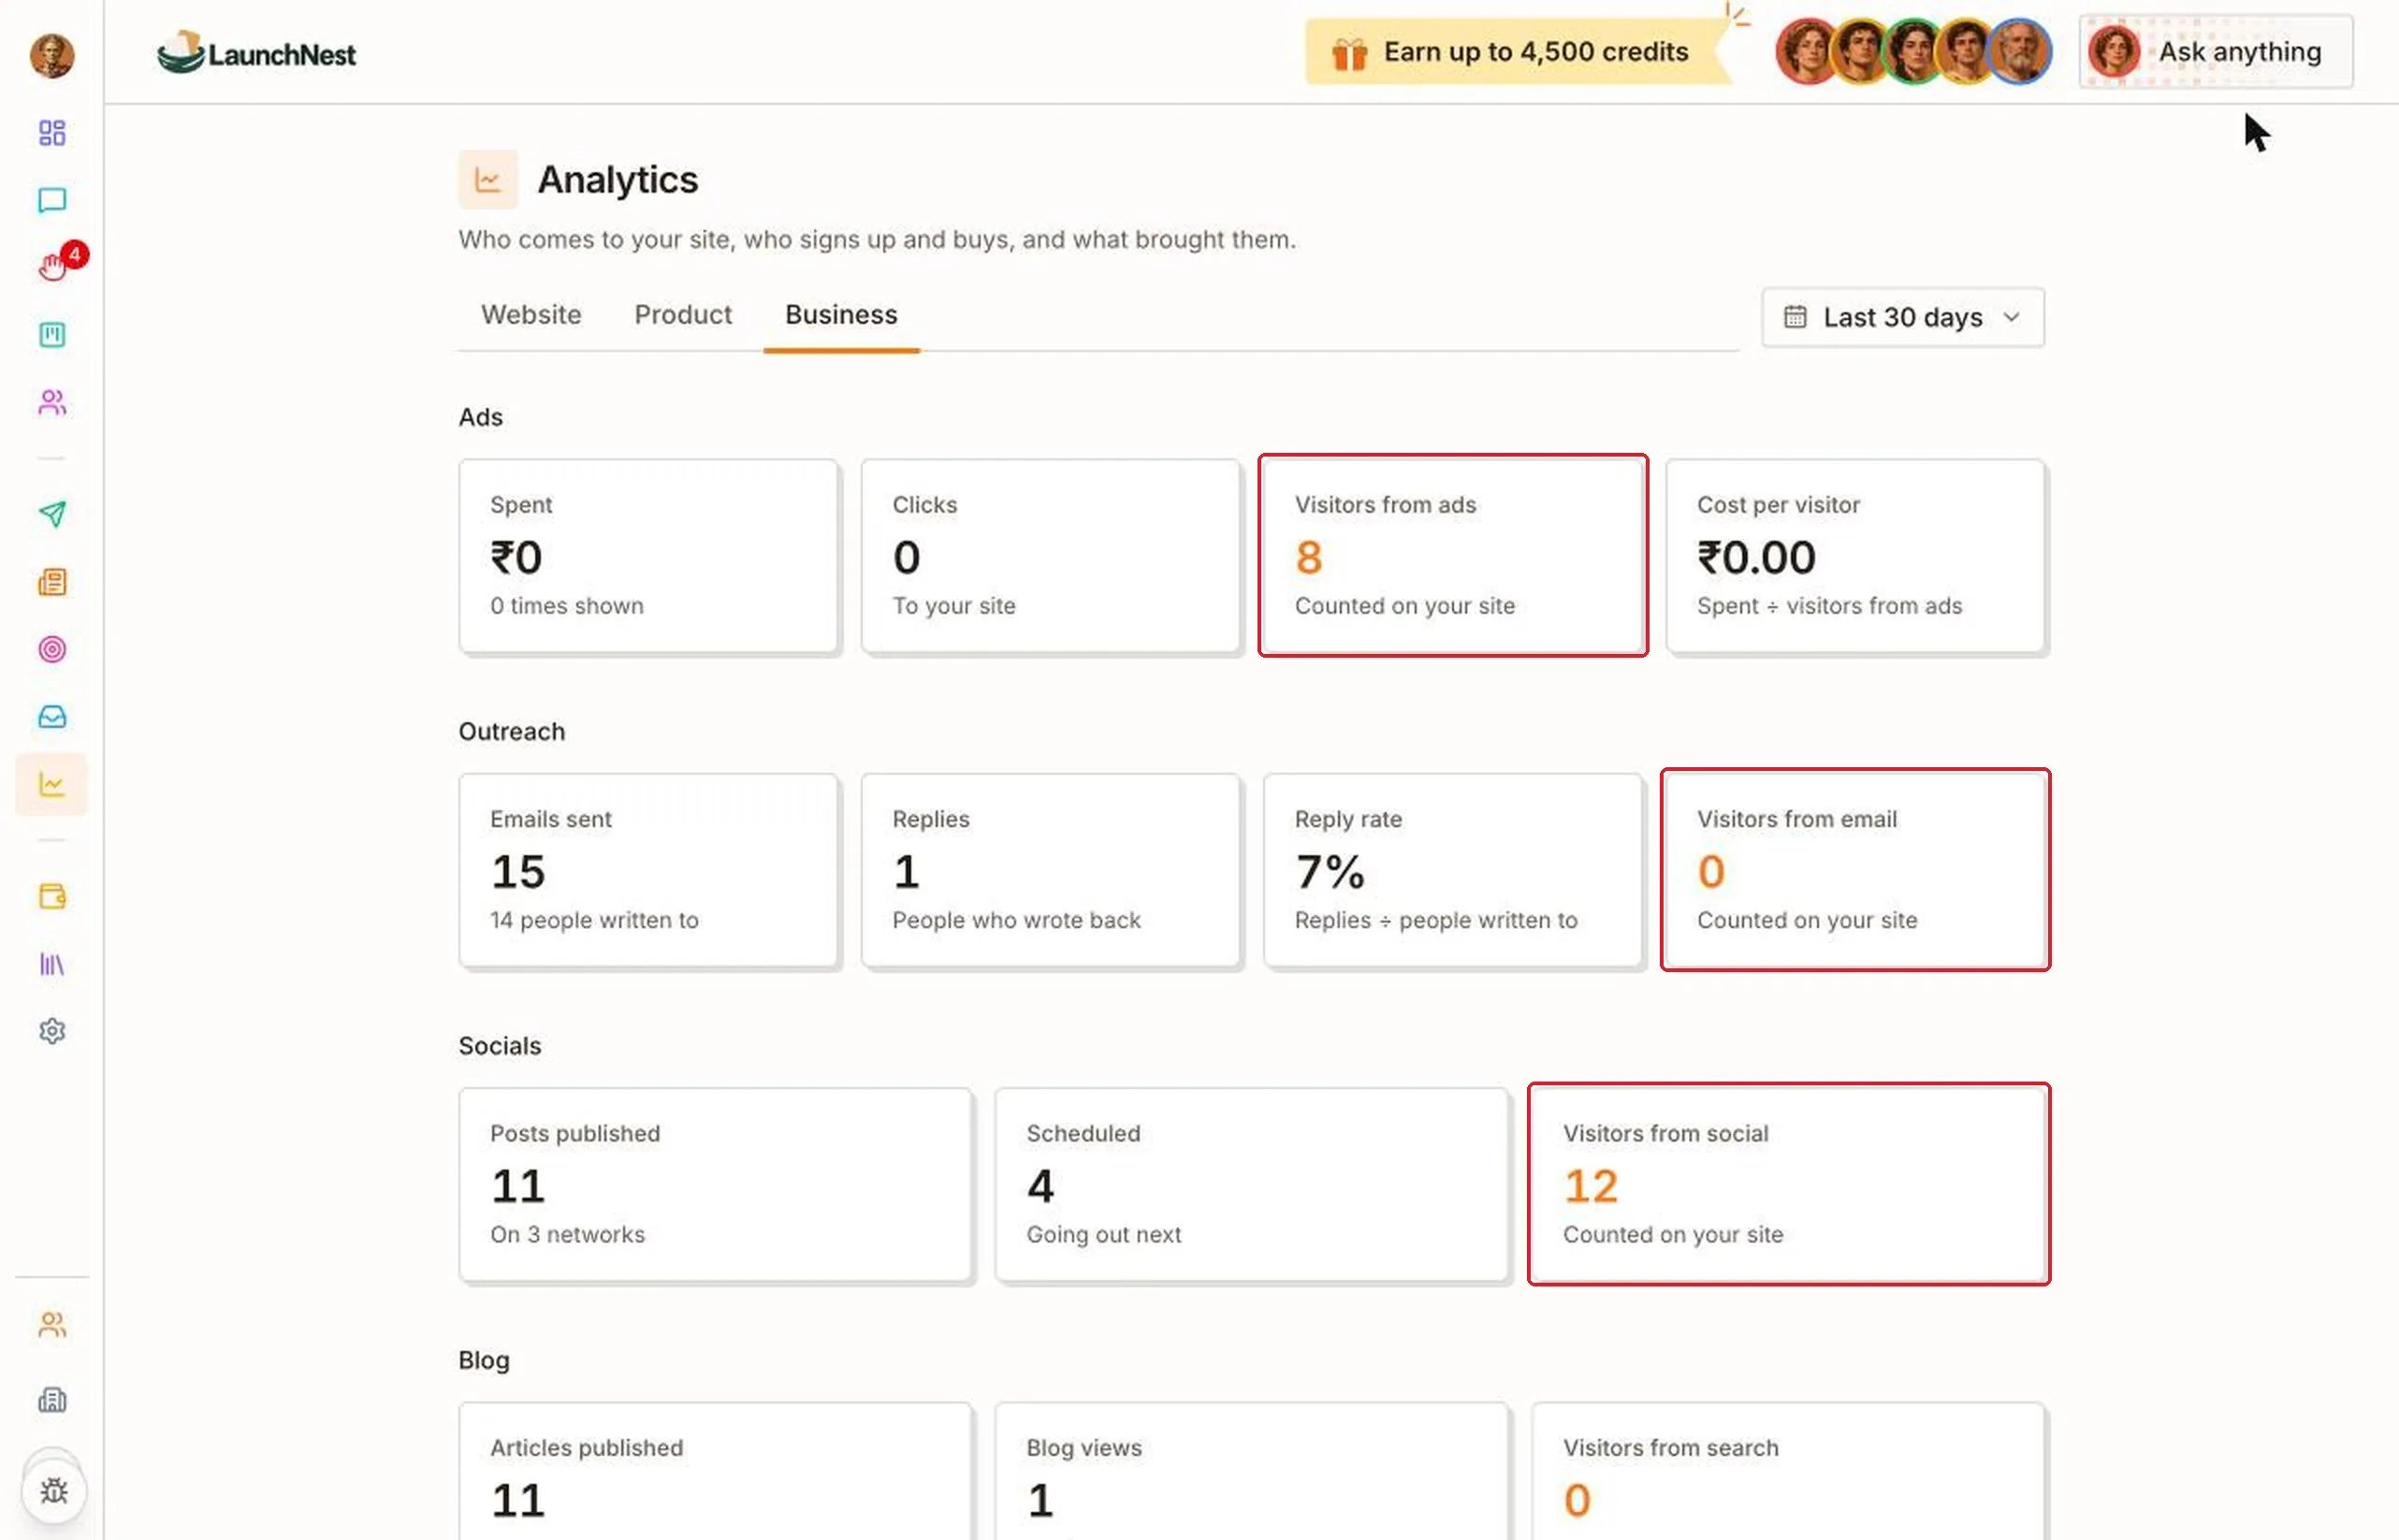
Tip: Don’t judge a channel in its first week. Pick “Last 30 days” before deciding what to change.
Quick answers
Do I need to set anything up?
Do I need to set anything up?
No. Counting starts by itself once your site is live.
Why does the blog show 0 visitors from search?
Why does the blog show 0 visitors from search?
New articles take time to appear in search results.
Can I ask about my numbers instead?
Can I ask about my numbers instead?
Yes. Ask the CEO, like “What do our numbers say this week?” It reads the same numbers. See Brainer CEO.
How far back can I look?
How far back can I look?
Up to Last 90 days in the quick options.